How to Read Stock Charts Effectively
In the fast-paced world of investing, grasping stock charts is crucial for making informed decisions. This article serves as your guide through the various types of stock charts and their essential components. You will learn how to interpret trends and indicators with confidence.
You ll explore both technical and fundamental analysis, equipping yourself with the tools needed to leverage stock charts in your investment strategies. You will also discover tips and insights from experts designed to help you sidestep common pitfalls and enhance your chart-reading skills.
Jump in now and transform your trading skills!
Contents
- Key Takeaways:
- Understanding Stock Charts
- Interpreting Stock Charts
- Using Stock Charts for Analysis
- Tips for Effective Stock Chart Reading
- Frequently Asked Questions
- What is the importance of learning how to read stock charts effectively?
- What are the basic elements of a stock chart?
- How do I interpret the different types of stock charts?
- What are some common patterns to look for on stock charts?
- How can I use technical indicators on stock charts to make better decisions?
- Are there any resources available to help me improve my understanding of reading stock charts?
Key Takeaways:

- Learn how to recognize different types of stock charts and their key components.
- Identify trends and read indicators to make informed decisions when analyzing stock charts.
- Utilize tools that help predict market trends for a comprehensive understanding of stock charts.
Understanding Stock Charts
Understanding stock charts is essential for anyone aiming to make informed trading decisions in the stock market. Stock charts show how prices change over time. They help you understand market trends and what traders are feeling.
These visual tools reveal insights into market dynamics and trader sentiment, enabling you to identify trends, support and resistance levels, and potential entry and exit points.
Various types of stock charts such as candlestick charts, line charts, and bar charts each provide distinct perspectives on trading volume and price fluctuations. By mastering these tools, you can enhance your investment strategies and optimize your portfolio for greater success.
Types of Stock Charts
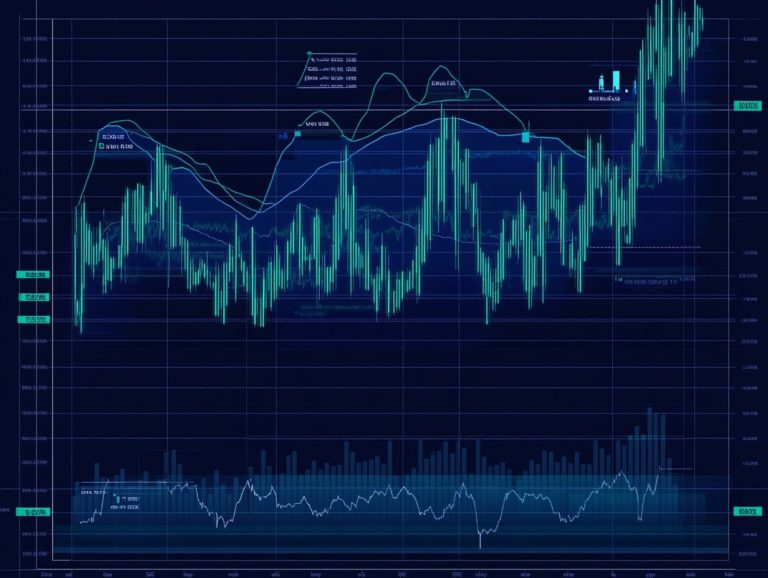
There are several types of stock charts to analyze stock performance and price trends, with candlestick charts, line charts, and bar charts being the most popular.
Each chart type serves a specific purpose, allowing you to visualize market activity and make informed decisions. For instance, candlestick charts show the open, high, low, and close prices in a specific time frame. They are excellent for identifying price patterns and reversals.
Line charts provide a clear view by connecting closing prices over time, making it easy to see long-term trends. Bar charts, with vertical lines indicating price movements and horizontal tick marks denoting opening and closing points, effectively illustrate trading volume alongside prices.
Together, these three chart types enhance your ability to recognize patterns and empower you to craft effective strategies in a constantly evolving market landscape.
Key Components of Stock Charts
Key components of stock charts include price history, trading volume, technical indicators, and crucial levels such as support and resistance. Each element plays a vital role in your chart analysis and investment strategies.
Understanding price history enables you to identify past performance trends and anticipate potential future movements. This can significantly impact your buy or sell decisions.
Trading volume provides insights into the strength or weakness of a trend, helping you gauge whether a price movement is likely to maintain its momentum.
Technical indicators, like moving averages and the relative strength index (RSI), add depth to your analysis and assist in forecasting market behavior.
Recognizing support and resistance levels is essential for making informed predictions about price reversals or continuations. This ultimately safeguards your investments and optimizes your trading outcomes.
Interpreting Stock Charts
Interpreting stock charts effectively is crucial for making informed trading decisions. Understanding how to read stock market charts gives you the power to recognize price movements, gauge market sentiment, and spot potential trading signals that could significantly influence your strategies.
Identifying Trends

Identifying trends in stock charts requires you to analyze price trends, market dynamics, and trading volume. This analysis helps you gauge the direction and strength of stock performance.
It empowers you to spot potential upward or downward movements while highlighting the importance of support and resistance levels. These levels act as psychological barriers where prices are likely to pause or reverse, offering invaluable insights into potential entry and exit points.
By closely observing historical price movements and volume fluctuations, you can identify key areas where the market may react. This significantly refines your trading strategies.
Understanding trend identification is essential. It provides you with a clearer picture of the broad market sentiment, enabling you to make informed decisions that align seamlessly with prevailing market dynamics.
Reading Indicators
Reading indicators on stock charts is an essential skill for you as a trader. These indicators provide valuable insights into price movements, trading signals, and potential market changes through various technical and financial metrics.
Among these tools, moving averages stand out as reliable indicators. They smooth out price fluctuations, helping you identify trends over specific time frames with greater clarity.
Momentum indicators, like the Relative Strength Index (RSI) a measure of how fast a stock is moving up or down and the Stochastic Oscillator assess the speed and direction of price movements. They help you determine whether a stock is overbought or oversold.
By weaving these indicators into your analysis, you can pinpoint crucial entry and exit points. This enhances your decision-making process and refines your overall trading strategy.
Understanding how these diverse indicators interact can substantially aid you in predicting potential market shifts.
Using Stock Charts for Analysis
Utilizing stock charts for analysis is a cornerstone of successful trading. In this realm, both technical and fundamental analysis are paramount. They enable you to assess stock performance with precision and craft informed investment strategies.
Technical Analysis
Technical analysis is your gateway to understanding stock charts and patterns. It enables you to forecast future price movements grounded in historical data and market trends.
This approach focuses on key elements that can dramatically influence your trading success, such as trend lines that illustrate the direction of asset prices. They help you discern whether the market is leaning towards a rising or declining market.
Chart patterns, like head and shoulders or double tops, can signal potential reversals or continuations in a stock’s price. Pairing this analysis with trading signals derived from technical indicators positions you to make informed decisions regarding entry and exit points.
By synthesizing these components, you unlock valuable insights into potential future price actions, empowering your trading strategy.
Fundamental Analysis
Fundamental analysis invites you to evaluate a stock’s true worth by diving into economic factors, financial indicators, and price history. This provides a rich context for your trading decisions.
By scrutinizing key financial metrics like earnings per share, revenue growth, and profit margins, you gain a clearer picture of a company’s underlying performance. This deeper analysis offers valuable insights into market conditions and potential risks, empowering you to make well-informed decisions.
While technical analysis focuses on price movements and patterns, integrating fundamental principles ensures your investment strategies are anchored not just in historical trends but also in the company’s financial health and the broader market environment.
Adopting this comprehensive approach can significantly enhance your stock performance assessments and lead to more successful trading outcomes.
Tips for Effective Stock Chart Reading

Effective stock chart reading is an art that combines analytical skills and trading experience. By mastering this craft, you can uncover valuable insights into market opportunities while minimizing risks.
This approach gives you the power to make informed investment decisions that can significantly enhance your trading success.
Avoiding Common Mistakes
Avoiding common mistakes in stock chart analysis is essential to reduce trading risks and make sound decisions based on accurate interpretations of market data.
Many individuals misinterpret key indicators, such as moving averages and volume levels, leading to ill-informed choices. It’s easy to fall into the trap of relying solely on historical patterns without considering current market trends.
Emotional reactions to short-term volatility, rather than logical assessments grounded in data, often result in hasty trades. To combat these pitfalls, you would benefit from employing a structured approach that combines technical analysis with a disciplined trading plan.
Regularly educating yourself about market dynamics and seeking mentorship from seasoned traders can further elevate your proficiency in chart analysis. Embrace these strategies, and you’ll navigate market complexities with confidence!
Expert Strategies
Implementing expert strategies in stock chart analysis can significantly enhance your ability to interpret price movements and trading volume, leading to more effective investment strategies.
By leveraging tools such as moving averages and trend lines, you gain invaluable insights into market trends. This helps you identify key support and resistance levels. Recognizing volume spikes can signal potential reversals or continuation patterns, allowing for timely entry and exit points.
Utilizing indicators like the Relative Strength Index (RSI), a tool that helps you see if a stock is overbought or oversold, directs you towards more informed decisions. Seasoned traders emphasize the importance of integrating these techniques to cultivate a comprehensive view of the market landscape, ultimately fostering a disciplined approach to your trading endeavors.
Frequently Asked Questions
What is the importance of learning how to read stock charts effectively?
Learning to read stock charts is crucial! It enables investors to analyze trends effectively and make informed decisions about buying and selling stocks.
What are the basic elements of a stock chart?

There are three main components of a stock chart: the x-axis (which represents time), the y-axis (which shows the stock price), and the actual line or bars that represent the stock’s price movements.
How do I interpret the different types of stock charts?
There are various types of stock charts, including line charts, bar charts, and candlestick charts. Line charts show the overall trend of a stock’s price, bar charts display the highs and lows, and candlestick charts provide more detailed information on price movements.
What are some common patterns to look for on stock charts?
Common patterns include support and resistance levels, trendlines, and chart patterns such as head and shoulders or cup and handle. These can help investors identify potential entry or exit points for a stock.
How can I use technical indicators on stock charts to make better decisions?
Technical indicators are mathematical calculations based on a stock’s price and volume, providing additional insights into market trends and stock performance. These can be used alongside stock charts to assist investors in making more informed decisions.
Are there any resources available to help me improve my understanding of reading stock charts?
Yes, there are many resources available, including online tutorials, books, and seminars, that can help you improve your skills in reading stock charts. Practicing regularly with real-time stock charts is also beneficial for gaining hands-on experience.


