7 Common Chart Patterns and Their Significance
Understanding chart patterns is crucial for you as a trader seeking to navigate the intricate landscape of financial markets.
This article delves into seven prevalent chart patterns, including Head and Shoulders and Cup and Handle, each providing invaluable insights into market behavior.
You ll discover how to identify, confirm, and leverage these patterns to make well-informed decisions. By comprehending both the significance and the limitations of chart patterns, you can refine your strategies and elevate your chances of success in the ever-evolving market.
Contents
- Key Takeaways:
- 1. Head and Shoulders
- 2. Double Top/Bottom
- 3. Cup and Handle
- 4. Flag and Pennant
- 5. Ascending/Descending Triangles
- 6. Bullish/Bearish Divergence
- 7. Wedge Patterns
- What Are Chart Patterns and Why Are They Important?
- How Do Traders Use Chart Patterns to Make Decisions?
- What Are the Key Components of a Chart Pattern?
- How Can Traders Identify and Confirm Chart Patterns?
- What Are the Common Mistakes to Avoid When Trading Based on Chart Patterns?
- How Do Chart Patterns Help Predict Future Price Movements?
- What Are the Limitations of Using Chart Patterns in Trading?
- How Can Traders Incorporate Chart Patterns into Their Trading Strategy?
- Frequently Asked Questions
- What are the 7 common chart patterns and their significance?
- How does the head and shoulders pattern signal a trend reversal?
- What is the significance of a double top or double bottom pattern?
- How is a triangle pattern formed and what does it indicate?
- What is the difference between a flag and a pennant pattern?
- How can a cup and handle pattern be used in trading?
Key Takeaways:
- Head and Shoulders, Double Top/Bottom, and Cup and Handle patterns can signal trend reversals.
- Flag and Pennant, Ascending/Descending Triangles, and Wedge patterns can indicate continuation of a trend.
- Bullish/Bearish Divergence can signal potential trend reversals or strength/weakness in a trend.
1. Head and Shoulders
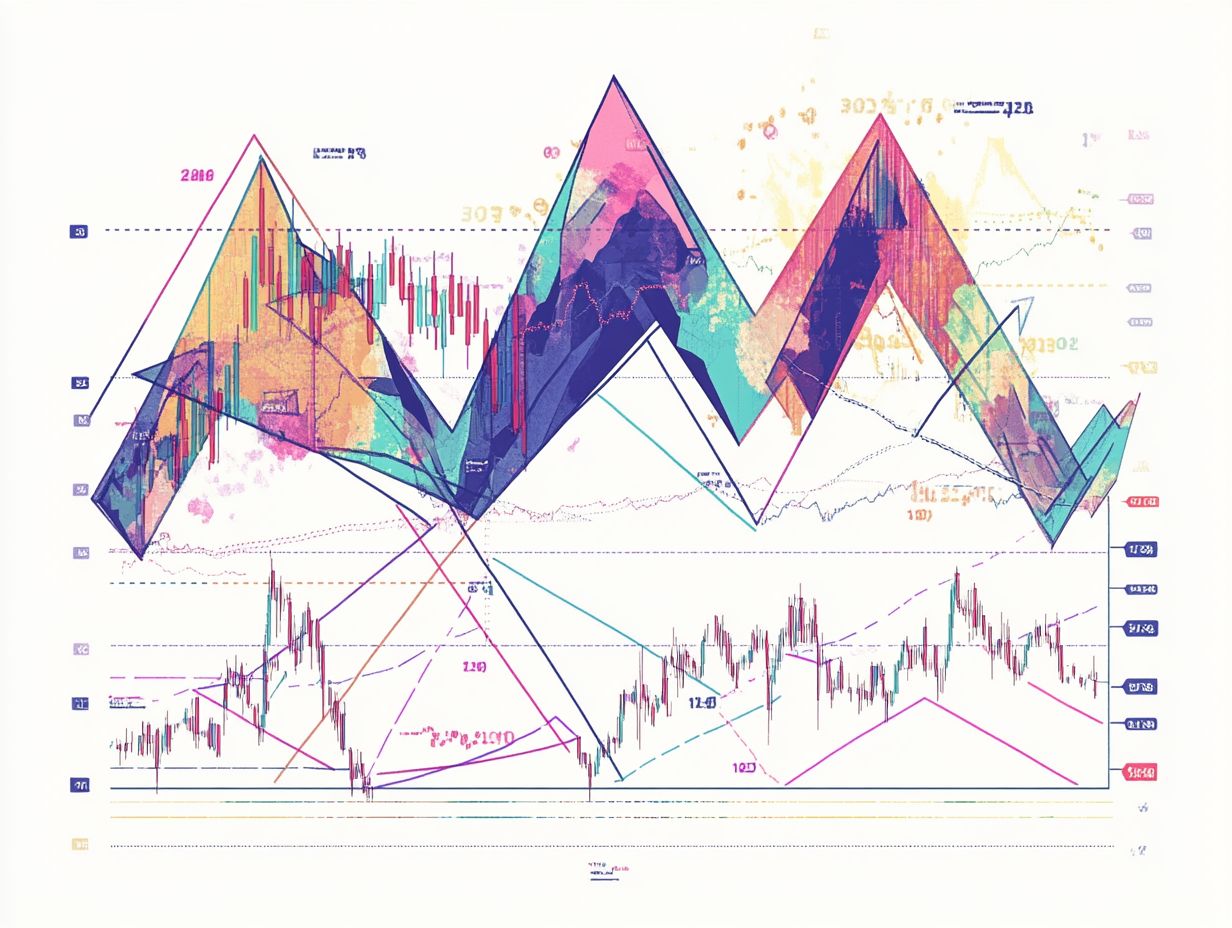
The Head and Shoulders pattern is an important chart pattern that you should be aware of, as traders have long recognized its ability to signal potential bullish or bearish reversals in market trends. Recognizing this pattern is essential for your technical analysis, which is the study of price movements to make trading decisions.
This pattern features three distinct peaks: the left shoulder, the head, and the right shoulder, forming a shape that’s readily identifiable on price charts. The left shoulder emerges when the price ascends to a peak before declining. Next comes the head, which reaches an even higher peak. Finally, the right shoulder mirrors the left and indicates a shift in trend momentum.
When this formation appears, it often foretells a reversal in direction, prompting you to reconsider your entry or exit points. By recognizing this pattern, you can refine your trading strategies and capitalize on potential market movements, enhancing your overall trading success.
2. Double Top/Bottom
The Double Top and Double Bottom patterns are invaluable chart formations that signify potential reversal points in price movement, serving as key trading signals for your market analysis.
These formations play a crucial role in helping you identify shifts in market sentiment. A Double Top typically signals a bearish reversal following a bullish trend, while a Double Bottom indicates a bullish reversal after a downtrend.
By understanding these patterns, you can better gauge where support and resistance levels are likely to form, allowing you to plan your entry and exit strategies more effectively. When the price breaks through these key levels, it can lead to significant price fluctuations, providing you with critical insights to refine your trading strategies and enhance your risk management techniques.
3. Cup and Handle
The Cup and Handle pattern is a bullish continuation formation that signals a potential breakout, frequently spotted on trading charts and cherished by traders for its ability to forecast upward price movement after a period of consolidation.
This distinctive pattern resembles a cup with a handle, where the cup signifies a prior decline, followed by a gradual recovery, and the handle illustrates a slight pullback before the expected surge. Traders often look for these formations as reliable indicators of a robust bullish trend, creating favorable entry points with reduced risk after a consolidation phase.
By integrating additional technical indicators, such as moving averages or volume analysis, you can further validate the strength of the pattern. This enhances your ability to pinpoint opportune trading moments while making well-informed predictions about future price movements.
Start analyzing these patterns today and watch how they enhance your trading strategy!
4. Flag and Pennant
Flag and Pennant patterns are important patterns in trading that signal potential continuations of existing trends. As a trader, you ll want to keep an eye out for breakout patterns (changes in price movement) that resonate with the prevailing price action.
These patterns often appear after sharp price movements and feature a brief consolidation phase, where the price crafts a small flag or pennant shape, reflecting indecision in the market. During this phase, you can pinpoint key entry points, gearing up for a momentum resurgence in the original direction. Generally, flags present a downward slope, while pennants take on the form of a symmetrical triangle.
By recognizing these formations, you can create winning strategies that capitalize on market volatility. Time your positions with precision to maximize your gains when the price breaks out, affirming the continuation of the overall trend.
5. Ascending/Descending Triangles
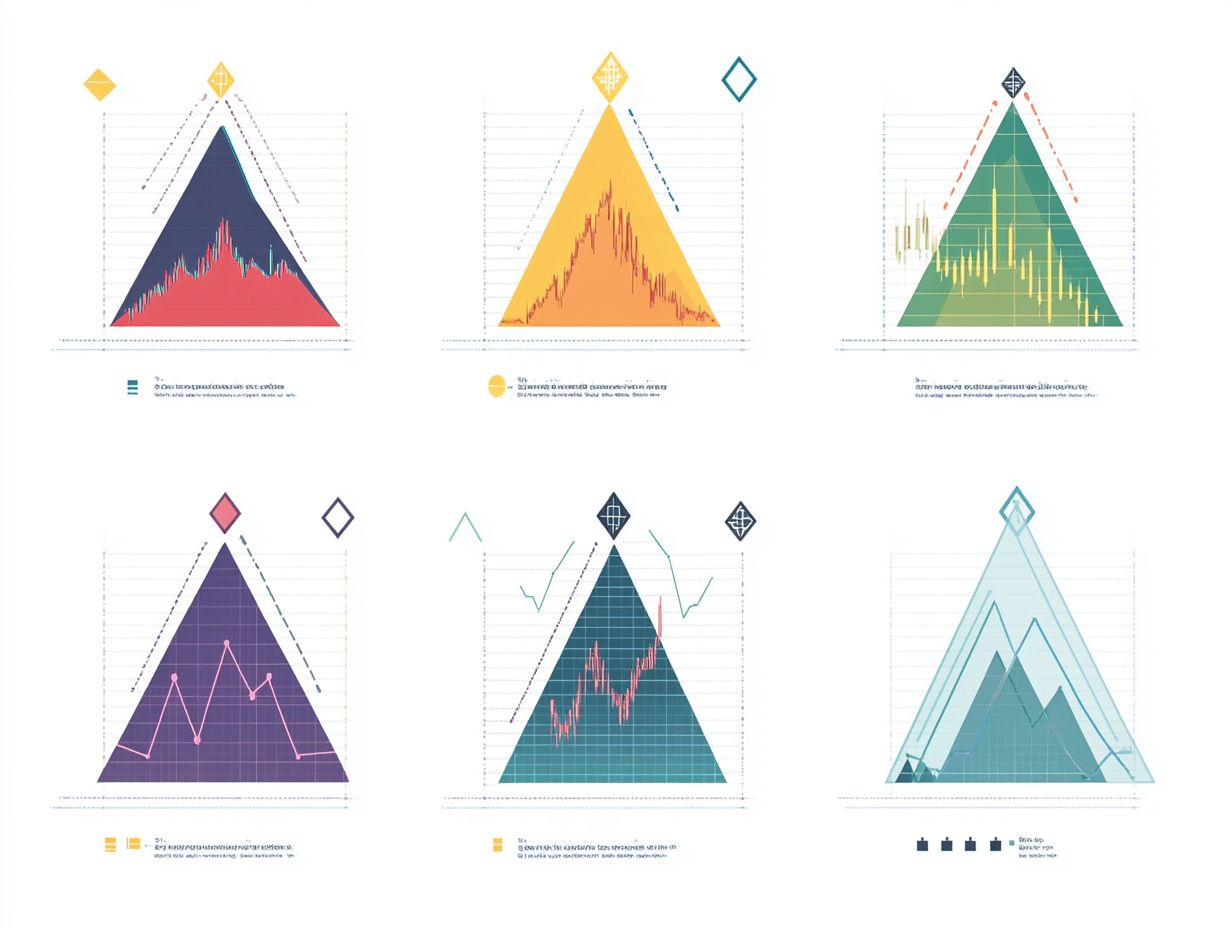
Ascending and Descending Triangles are essential chart patterns that help you assess price action and predict potential breakouts. The Ascending Triangle often signals bullish scenarios, while the Descending Triangle hints at bearish trends.
These patterns highlight the points where buyers and sellers meet, creating clear support and resistance levels. In an Ascending Triangle, you ll notice the price repeatedly testing a horizontal resistance while forming higher lows this indicates growing buyer pressure. Conversely, the Descending Triangle reveals a consistent price decline accompanied by a horizontal support level, suggesting a strong seller presence.
If you’re looking to refine your trading strategies, you can capitalize on these formations by entering positions when breakouts are confirmed. It s wise to place stop-loss orders (orders that limit potential losses) just outside the triangle boundaries to manage risk effectively, giving you a more structured approach to trading.
6. Bullish/Bearish Divergence
Bullish and bearish divergences are crucial signals in your chart analysis toolkit. These occur when the price action of a financial instrument diverges from technical indicators, often hinting at potential reversals in market sentiment and trading positions.
To effectively spot these divergences, utilize various technical indicators like the Relative Strength Index (RSI), Moving Average Convergence Divergence (MACD), or Stochastic Oscillator. For example, if the price creates higher highs while the RSI dips, it may suggest weakening momentum, signaling a bearish divergence. Conversely, if the price hits lower lows but the RSI climbs, you’re observing a bullish divergence.
Understanding these discrepancies is essential, as they can accurately predict shifts in market trends. This knowledge allows you to refine your strategies and enhance your decision-making, ultimately boosting your potential for profitable trades.
7. Wedge Patterns
Wedge patterns, defined by converging trend lines, indicate potential shifts in price action, whether bullish or bearish. They play a crucial role in technical analysis, especially for those looking to anticipate breakout patterns.
These formations typically fall into two categories: rising wedges and falling wedges, each carrying its own implications for market trends. A rising wedge often hints at weakening momentum in an uptrend, potentially leading to a reversal. In contrast, a falling wedge can signal bullish potential as prices consolidate downwards.
As you navigate these formations, keep a close eye on volume. An increase in volume during a breakout often bolsters the reliability of the signal. By implementing strategies that involve setting entry points above resistance for bullish breakouts or below support for bearish scenarios, you can refine your decision-making process and effectively manage risk.
Start tracking these patterns today and elevate your trading game!
What Are Chart Patterns and Why Are They Important?
Chart patterns are your visual guideposts, illustrating historical price movements on trading charts. They empower you to analyze price action and identify trading signals.
These patterns help craft effective trading strategies, making them essential in technical analysis.
Patterns like head and shoulders, double tops and bottoms, and triangles are not just shapes; they are vital indicators of potential market reversals or continuations. They provide deep insights into trader psychology, shedding light on how market sentiment evolves over time an essential aspect of grasping price fluctuations.
Recognizing these patterns helps you anticipate price changes and make informed decisions, significantly enhancing your trading success. Understanding the market dynamics these patterns reflect enables you to engage in more strategic position sizing and risk management, thereby cementing their role as essential tools in your trading arsenal.
How Do Traders Use Chart Patterns to Make Decisions?
You can use chart patterns to make better trading decisions by looking at price movements and predicting where prices might go next. Integrating these patterns into your trading strategies will enhance your accuracy and effectiveness.
To achieve this, you ll need to meticulously examine historical price charts, searching for recurring formations like head and shoulders, triangles, and flags. By identifying these patterns, you ll gain invaluable insights into market psychology and spot potential trend reversals.
Your interpretation of these formations can be further refined by considering key technical indicators, such as moving averages and volume analysis, which will boost your predictive capabilities. As these patterns unfold, you can adjust your strategies accordingly, determining entry and exit points that align with your risk tolerance, enabling you to make more calculated decisions in the ever-fluctuating markets.
What Are the Key Components of a Chart Pattern?
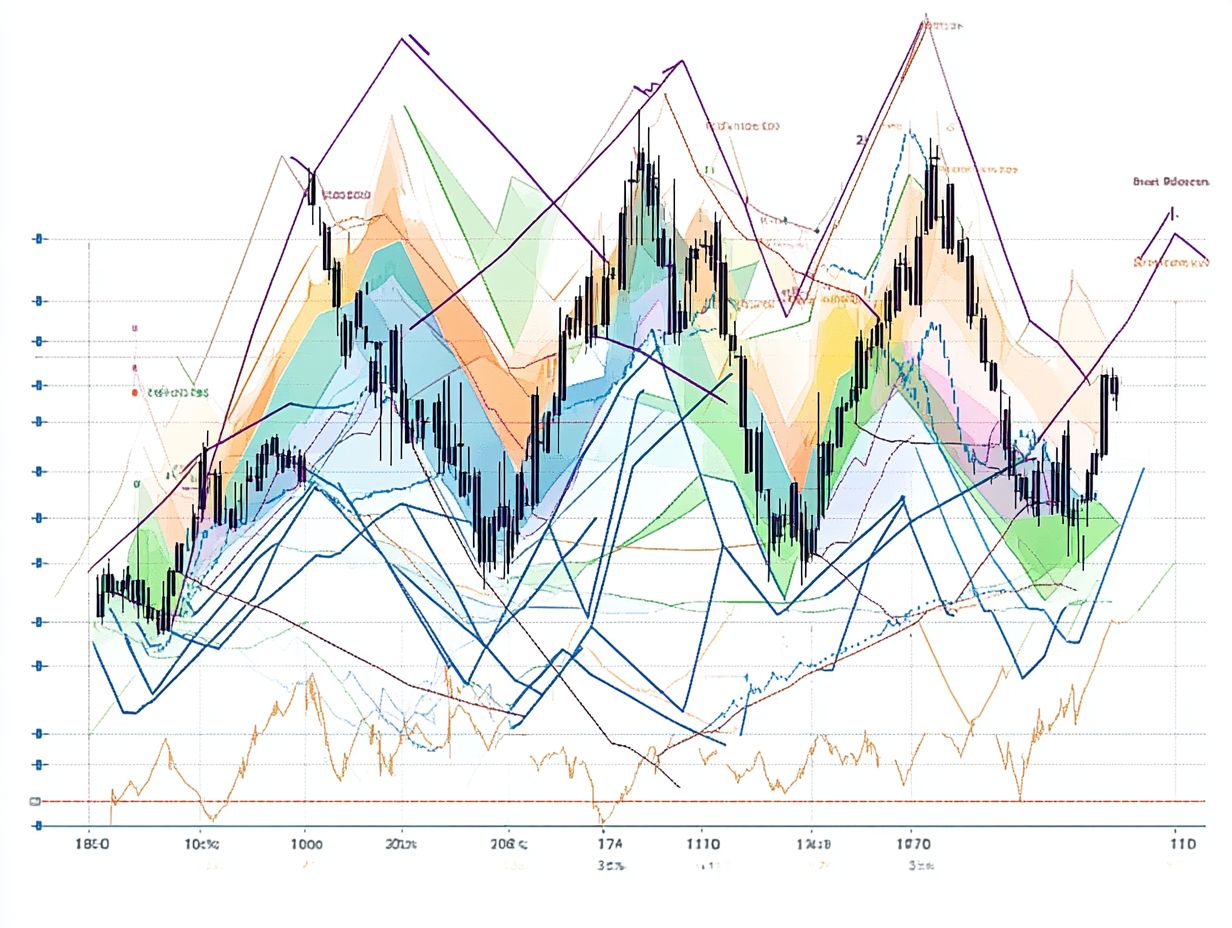
Key components of a chart pattern include its structure, trend lines, price levels, and volume. Each component is crucial for evaluating price action.
By grasping the structure, you can identify various formations, like triangles or head-and-shoulders, which often signal potential market reversals or continuations. Trend lines offer vital insights into the overall direction and strength of price movement, while specific price levels assist in pinpointing support and resistance zones.
Volume acts as a way to confirm, indicating the strength behind a price move. By considering these elements, you significantly enhance your ability to formulate and confirm effective trading strategies, leading to more informed decisions in the market.
How Can Traders Identify and Confirm Chart Patterns?
Quickly identify and confirm chart patterns using technical indicators and price analysis. This can boost your trading success!
This multifaceted approach significantly enhances your decision-making process. For instance, by utilizing moving averages, you can smooth out price fluctuations and gain a clearer view of the overall trend. Volume indicators offer valuable insights into market activity, allowing you to determine whether a breakout is genuine or likely to fizzle out.
When you observe candlestick formations alongside these tools, you deepen your understanding of market psychology, uncovering clues about potential reversals or continuations. Ultimately, integrating these methods not only sharpens your analysis but also boosts your confidence in executing trades based on well-founded patterns.
What Are the Common Mistakes to Avoid When Trading Based on Chart Patterns?
Common mistakes in trading based on chart patterns can lead to significant financial losses. You might find yourself misinterpreting signals, neglecting necessary confirmation, or overlooking the ever-present market volatility.
To tackle these challenges, use a disciplined approach that emphasizes thorough technical analysis. By dedicating time to study historical trends and patterns, you can gain a deeper understanding of potential outcomes. This ultimately enhances your decision-making process.
Staying attuned to market sentiment and external influences provides crucial context that can significantly affect chart behavior.
Practicing sound risk management and setting realistic goals are vital components in minimizing mistakes and achieving sustainable success in your trading endeavors.
How Do Chart Patterns Help Predict Future Price Movements?
Chart patterns play an important role in helping you anticipate future price movements by analyzing historical price action and spotting recurring formations that reflect market trends and trader sentiment.
When you observe these formations, you gain valuable insights into potential shifts in supply and demand dynamics, which give you the power to make informed decisions. Patterns like head and shoulders, triangles, and flags act as indicators of momentum and reversal, often hinting at where a security might be headed next.
By weaving signals from these patterns into your trading strategies, you can pinpoint optimal entry and exit points that align with your expectations for price movement. Additionally, understanding volume trends alongside these patterns bolsters credibility, enabling you to fortify your positions around key support and resistance levels.
What Are the Limitations of Using Chart Patterns in Trading?
While chart patterns serve as valuable tools in trading, they do come with their own set of limitations. They rely heavily on historical data, can generate false signals, and can be affected by sudden market changes.
These factors might lead you to misinterpretations of trends, resulting in costly trading decisions. If you re heavily dependent on these patterns, you could easily overlook sudden market shifts triggered by economic news or unexpected events.
To navigate these challenges effectively, it s essential to complement your chart analysis with additional methods, such as fundamental analysis or sentiment indicators. By diversifying your analytical toolkit, you can achieve a more comprehensive understanding of market conditions, enhancing your decision-making process and mitigating the risks associated with solely relying on patterns.
This multifaceted approach not only strengthens your trading strategies but also cultivates greater adaptability in an ever-evolving market landscape.
How Can Traders Incorporate Chart Patterns into Their Trading Strategy?

You can effectively weave chart patterns into your trading strategies by aligning them with robust technical analysis techniques. This involves leveraging trading signals to pinpoint your entry and exit points, as well as adjusting your approach based on price action.
For instance, consider using moving averages to confirm patterns such as head and shoulders or flags, ensuring that your trades are firmly rooted in reliable data. Applying indicators like Relative Strength Index (RSI) or Moving Average Convergence Divergence (MACD) will help you identify potential overbought or oversold conditions, ultimately boosting your trade success rate.
Integrating Fibonacci retracement levels, a way to find potential support and resistance areas, can also offer valuable insights that align with your chart patterns, enabling you to make more informed decisions.
Remember, your journey doesn t culminate with those initial successes; ongoing education through market analysis, strategy workshops, and real-time trading simulations will significantly enhance your skill set and adaptability in the ever-evolving trading landscape. Stay ahead of the market! Your trading success depends on it!
Frequently Asked Questions
What are the 7 common chart patterns and their significance?
The 7 common chart patterns include:
- Head and shoulders
- Double top and double bottom
- Triangle
- Flag
- Pennant
- Wedge
- Cup and handle
These patterns are significant because they can indicate potential trends and help traders make informed decisions about buying and selling stocks.
How does the head and shoulders pattern signal a trend reversal?
The head and shoulders pattern forms when the price peaks, drops, then peaks higher before dropping again. A break below the neckline signals a potential downtrend.
What is the significance of a double top or double bottom pattern?
A double top occurs when the price peaks twice before dropping. This indicates resistance and suggests a trend reversal.
Conversely, a double bottom signals strong support and hints at a possible uptrend.
How is a triangle pattern formed and what does it indicate?
A triangle pattern appears when prices create lower highs and higher lows, forming a triangle shape. This signals market indecision, and a breakout can lead to a strong trend.
What is the difference between a flag and a pennant pattern?
A flag pattern forms after a sharp price move followed by a consolidation phase with parallel trendlines. In contrast, a pennant has converging trendlines during consolidation, both suggesting continuation of the previous trend.
How can a cup and handle pattern be used in trading?
A cup and handle pattern emerges when the price dips and then rises, forming a cup shape with a small handle. This bullish pattern often signals a buying opportunity as the price typically continues to rise after breaking out from the handle.


