5 Key Principles of Technical Analysis
In the dynamic world of trading, grasping market behavior is crucial for making informed decisions.
This article delves into five key principles of technical analysis that can illuminate price movements and market trends. From understanding the predictability of price fluctuations to recognizing the importance of historical patterns, you ll discover how technical analysis can be a powerful ally in your trading endeavors.
Explore different chart types and key indicators. Learn how to combine technical and fundamental analysis for a stronger strategy.
Join in as the art of technical analysis is demystified, revealing its significance in navigating the complexities of the financial markets.
Contents
- Key Takeaways:
- 4. Market Discounts Everything
- 5. Technical Analysis is a Self-Fulfilling Prophecy
- What is Technical Analysis and How Does It Work?
- How Can Technical Analysis Help with Trading Decisions?
- What Are the Most Common Technical Indicators?
- How Can Technical Analysis Be Used in Conjunction with Fundamental Analysis?
- What Are the Limitations of Technical Analysis?
- Frequently Asked Questions
- What are the 5 Key Principles of Technical Analysis? Find Out!
- What is trend analysis in Technical Analysis?
- How does support and resistance play a role in Technical Analysis?
- What are chart patterns and how are they used in Technical Analysis?
- What role do indicators play in Technical Analysis?
- How important is risk management in Technical Analysis?
Key Takeaways:
- Unlock the potential to predict price movements with technical analysis.
- Seize opportunities as market trends persist!
- Learn from history: past patterns can guide your future trading.
1. Price Movement is Predictable
In the realm of financial markets, the predictability of price movement is paramount in shaping your trading strategies. It offers you, as an investor or technical analyst, invaluable insights into potential market trends and trading opportunities.
By analyzing historical price action and volume data, you can identify patterns that may help forecast future price changes, thereby enhancing your investment decisions.
Technical analysis tools, such as chart patterns and indicators, are essential in this process. For example, configurations like head and shoulders or double tops often indicate potential reversals, while bullish flags can hint at a continuation of an upward trend, making it important to master essential technical analysis skills for traders.
When you recognize these patterns, you position yourself to capitalize on future price fluctuations. Utilizing indicators like the Relative Strength Index (RSI) allows you to identify overbought or oversold conditions, guiding you toward informed entry or exit decisions.
Historical events, such as the meteoric rise and subsequent fall of stock prices during the dot-com bubble, underscore how grasping these patterns can lead to more strategic investment opportunities.
These insights also enhance effective risk management.
2. Market Trends Tend to Persist
Market trends tend to have a remarkable persistence, shaped by collective market sentiment and the nuances of behavioral finance. This dynamic allows you to capitalize on sustained price movements and make well-informed investment decisions.
By exploring market psychology, you gain valuable insights into the emotions and motivations that drive price fluctuations. This understanding enables you to identify and interpret key technical indicators that signal the continuation of trends.
For example, moving averages can smooth out price data, revealing the overall direction of the trend. Similarly, the Relative Strength Index (RSI) provides crucial insights into whether a market is overbought or oversold, giving you essential context for potential reversals or continuations.
Understanding these psychological elements and indicators can greatly improve your trading decisions.
3. History Repeats Itself
The idea that history tends to repeat itself in the financial markets is firmly rooted in the principles of behavioral finance. As a trader, you might notice that your reactions to market events are similar to those of past traders. This leads to recognizable price changes and patterns that can be effectively analyzed through technical analysis.
By looking into extensive historical market data, you can uncover recurring trends like the seasonal effects seen in agricultural commodities or the ever-present cycle of bull and bear markets (periods when prices go up or down) in equities.
Take the dot-com bubble of the late 1990s, for instance; it stands as a vivid reminder of unchecked speculation. Its aftermath offers invaluable insights into risk management and valuation.
Similarly, the 2008 financial crisis serves as a cautionary tale about the perils of overlooking rising debt levels. These historical precedents emphasize the critical importance of monitoring market behavior and arm you with strategies that capitalize on these identified patterns.
This knowledge enables you to make more informed decisions in today s dynamically trading landscape.
Ready to enhance your trading skills? Start analyzing market patterns today!
4. Market Discounts Everything

The principle that the market discounts everything indicates that all available information ranging from economic indicators to market sentiment is already woven into current price movements. This makes it crucial for you to incorporate both fundamental and technical analysis into your investment strategies.
By grasping this principle, you can maneuver through the complexities of the market with greater efficacy. Recognizing that economic reports, earnings releases, and geopolitical factors interact will help you understand how they influence price movements.
Incorporating technical indicators, such as moving averages or momentum oscillators, offers crucial insights that can guide your trading decisions. Blending these approaches enables you to make more informed decisions, seize emerging opportunities, and mitigate the risks tied to volatile price movements.
5. Technical Analysis is a Self-Fulfilling Prophecy
In the realm of trading, technical analysis acts as a self-fulfilling prophecy. Your collective beliefs and actions, driven by charts, indicators, and patterns, can significantly influence price movements and shape market sentiment, making it essential to follow the best practices for technical analysis.
This reliance creates a feedback loop. As you and other traders anticipate similar reactions, specific price patterns become amplified. For example, when you spot a descending triangle on a chart, it s likely that you ll decide to sell, which can push the price down further, reinforcing that original signal.
On the flip side, when bullish setups like a golden crossover emerge, they often trigger a buying frenzy that can send prices soaring! This cycle not only perpetuates existing trends but also solidifies the belief that certain technical indicators possess predictive power, embedding these behaviors deeper into the trading psyche.
What is Technical Analysis and How Does It Work?
Technical analysis is an effective method in financial markets that you can use, focusing on historical price action and volume data to shape your trading strategies and investment decisions. This approach enables you to identify trends and potential trading opportunities based on past market behavior.
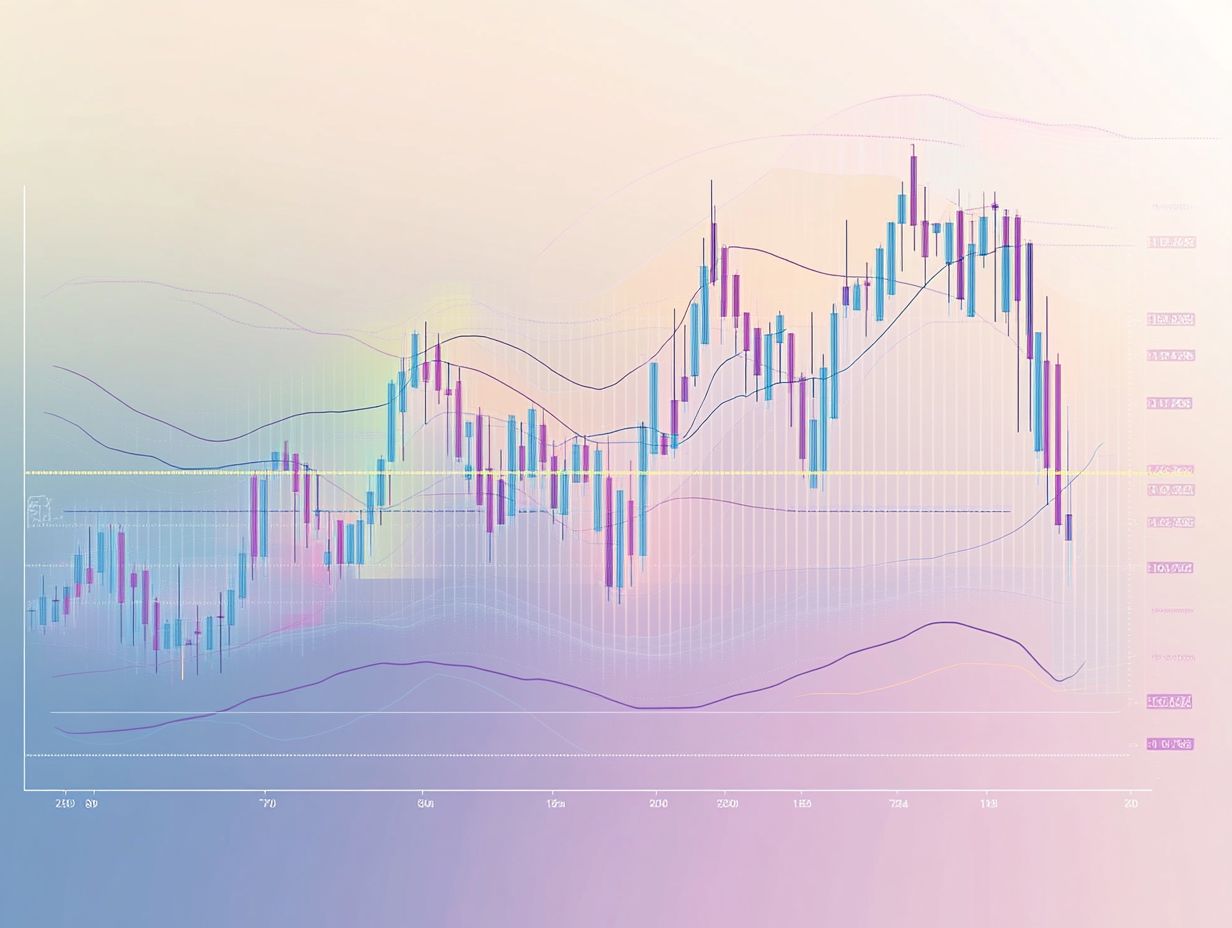
By utilizing this analytical framework, you gain valuable insights into market psychology and sentiment, essential for making well-informed decisions. With tools like candlestick charts and line graphs, you can visualize price movements over time, turning numbers into meaningful patterns.
The importance of chart patterns, such as head and shoulders, along with key indicators like moving averages and the Moving Average Convergence Divergence (MACD) a trend-following momentum indicator cannot be overstated.
These tools enable you to assess market momentum and spot trend reversals, equipping you to formulate strategies that resonate with market dynamics.
Dive deeper into these strategies now to start making informed trades!
What Are the Different Types of Charts Used in Technical Analysis?
In technical analysis, you’ll encounter various chart types like candlestick charts, line charts, and bar charts that are essential tools for visualizing price action and identifying trends, as well as support and resistance levels. Understanding strategies for long-term technical trading can also help in recognizing trading opportunities.
Each chart type offers unique insights that can be pivotal in your decision-making. For instance, candlestick charts deliver a wealth of information through their open, high, low, and close values, allowing you to quickly gauge market sentiment. This is particularly advantageous during volatile market conditions, where understanding price action can lead to profitable trades.
Line charts, in contrast, present a simplified view, making it easy for you to spot long-term trends and identify potential breakout points. Meanwhile, bar charts provide a more intricate showcase of price movement, favored for their ability to highlight price oscillations within a trading range.
By grasping these unique features, you can navigate various trading scenarios more effectively and make well-informed decisions.
How Can Technical Analysis Help with Trading Decisions?
Technical analysis significantly enhances your trading decisions by providing insights derived from price action, market trends, and various indicators. This information helps you pinpoint optimal entry and exit points in the financial markets.
Utilizing tools like the Relative Strength Index (RSI) allows you to assess whether a security is overbought or oversold, enabling more informed decisions.
The Moving Average Convergence Divergence (MACD) helps identify potential trend reversals or continuations, offering clearer insights into market momentum.
Bollinger Bands play a critical role in delivering insights on market volatility, helping you recognize when a price might be approaching an extreme point, signaling a potential entry or exit. These indicators empower you to craft more effective strategies, navigating the complexities of the market with confidence.
What Are the Most Common Technical Indicators?
Commonly used technical indicators in trading include the Relative Strength Index (RSI), Moving Average Convergence Divergence (MACD), and Bollinger Bands. Each tool serves a distinct purpose in analyzing market trends and price movements.
These indicators help assess whether a security is overbought or oversold, identify potential buy and sell signals, and gauge market volatility. The RSI is calculated based on recent price gains and losses, measuring momentum on a scale from 0 to 100. Values above 70 indicate overbought conditions, while those below 30 indicate oversold status.
The MACD tracks the relationship between two moving averages of a security’s price, allowing you to spot trends and potential reversals clearly. Meanwhile, Bollinger Bands, which consist of a middle band and two outer bands, reflect volatility and price levels, helping you anticipate price fluctuations.
By interpreting these indicators together, you can significantly enhance your decision-making processes and increase your chances of executing profitable trades.
How Can Technical Analysis Be Used in Conjunction with Fundamental Analysis?
Integrating technical analysis with fundamental analysis can elevate your investment strategies. Harmonizing insights from price action with underlying economic factors and market conditions positions you for greater success.
This combination deepens your understanding of market dynamics and enables informed decisions that can influence trading outcomes. For instance, spotting a bullish chart pattern alongside strong earnings reports or favorable economic indicators allows you to approach your next move confidently.
Conversely, if technical indicators signal overbought conditions in a market showing declining fundamentals, consider it a warning for a potential reversal. Merging these methodologies offers a comprehensive perspective, enabling adaptation to evolving market conditions and enhancing strategy effectiveness.
What Are the Limitations of Technical Analysis?
Despite its popularity, technical analysis has limitations. Price movements can be misinterpreted due to market psychology, and relying solely on historical data may not guarantee accurate future predictions. To enhance your trading strategy, consider exploring the top 5 technical indicators for stock trading.
Traders often encounter challenges such as false signals that lead to losses. Market anomalies and unexpected events can disrupt established patterns, making it difficult to depend solely on charts and indicators.
To mitigate these risks, adopt a diversified strategy that blends fundamental analysis and sentiment evaluation. This approach enhances your decision-making process.
Implementing strict risk management tactics such as setting stop-loss orders and regularly reviewing market conditions equips you to navigate the unpredictable nature of the markets.
Unlock the secrets of trading success with these powerful tools!
Frequently Asked Questions
What are the 5 Key Principles of Technical Analysis? Find Out!
The 5 Key Principles of Technical Analysis are trend analysis, support and resistance, chart patterns, indicators, and risk management.
What is trend analysis in Technical Analysis?
Trend analysis helps you understand market movements. It points out when to buy or sell.
How does support and resistance play a role in Technical Analysis?
Support and resistance levels show where prices might change direction. They are essential for making informed trading decisions.
What are chart patterns and how are they used in Technical Analysis?
Chart patterns on price charts reveal trends. They help you decide when to enter or exit a trade.
What role do indicators play in Technical Analysis?
Indicators use math to analyze price data. They help spot market trends and can confirm other analysis methods.
How important is risk management in Technical Analysis?
Risk management is vital for successful trading. It helps you cut losses and protect profits by setting stop-loss orders.


