Key Support and Resistance Levels Explained
Support and resistance levels are essential concepts in trading that can greatly impact market behavior.
This article delves into these critical terms and examines their significance in developing effective trading strategies. You’ll discover how to pinpoint these levels using a range of technical analysis tools and strategies that empower you to make informed entry and exit decisions.
The article will also highlight common pitfalls to avoid when interpreting these levels, ensuring you navigate the market with confidence. By the end, you’ll possess a clearer understanding of how to effectively leverage support and resistance levels in your trading approach.
Contents
- Key Takeaways:
- Understanding Support and Resistance Levels
- Importance of Support and Resistance Levels
- Identifying Support and Resistance Levels
- Using Support and Resistance Levels to Make Trading Decisions
- Common Mistakes to Avoid
- Frequently Asked Questions
- What are key support and resistance levels?
- How are key support and resistance levels determined?
- Why are key support and resistance levels important?
- How can I use key support and resistance levels in my trading?
- Do key support and resistance levels work in all markets?
- Are there any strategies for trading with key support and resistance levels?
Key Takeaways:

- Support and resistance levels are key technical indicators that can greatly impact trading strategies and decision-making.
- Identifying support and resistance levels requires the use of technical analysis tools and techniques, such as trend lines (lines drawn on charts to indicate the movement of prices) and moving averages (average prices over a specified time period).
- Misinterpreting levels and overlooking other factors can lead to common mistakes, so it is important to carefully analyze support and resistance levels in conjunction with other market factors before making trading decisions.
Understanding Support and Resistance Levels
Understanding support and resistance levels is essential for you as a trader or investor in the financial markets. These key price points reveal the market psychology that influences the emotional behavior of participants.
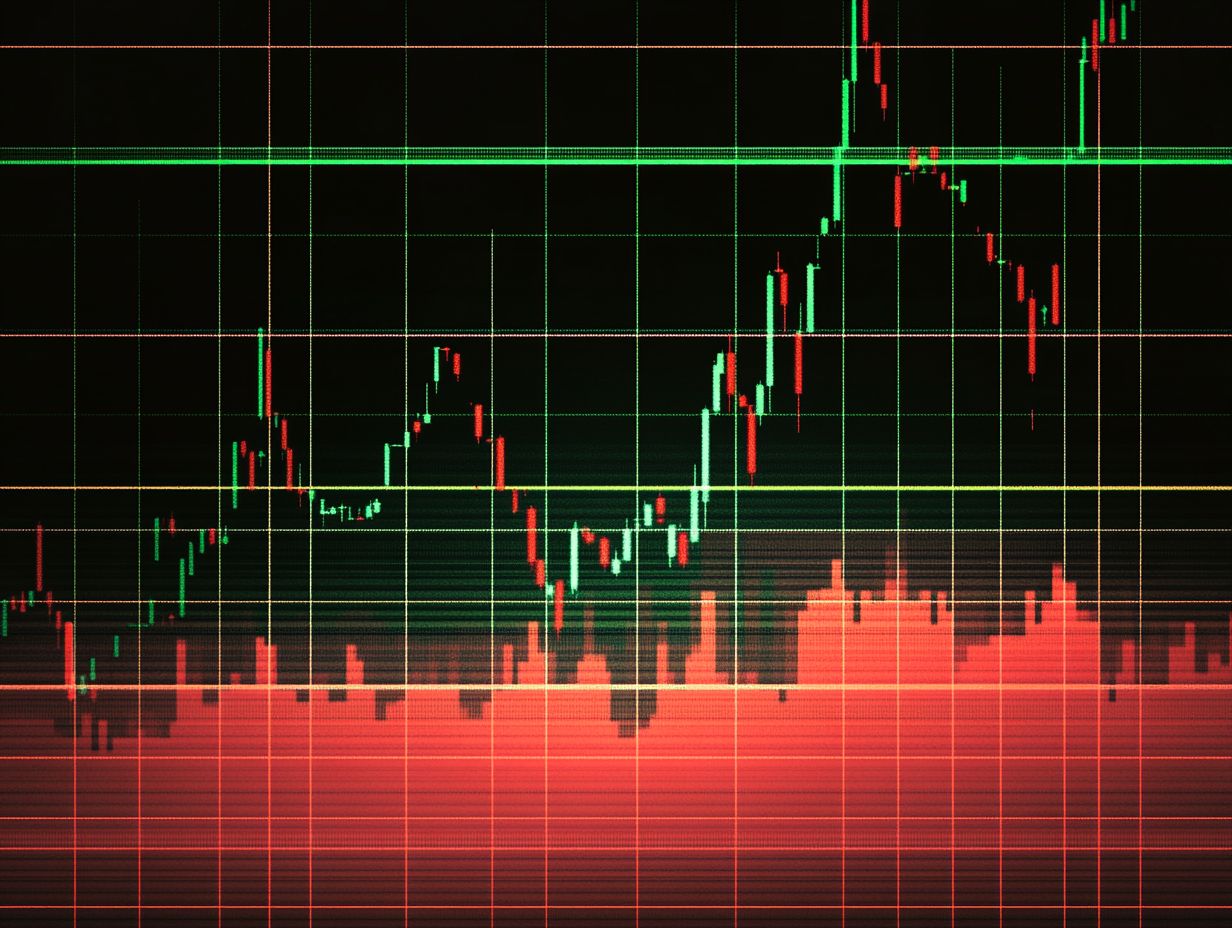
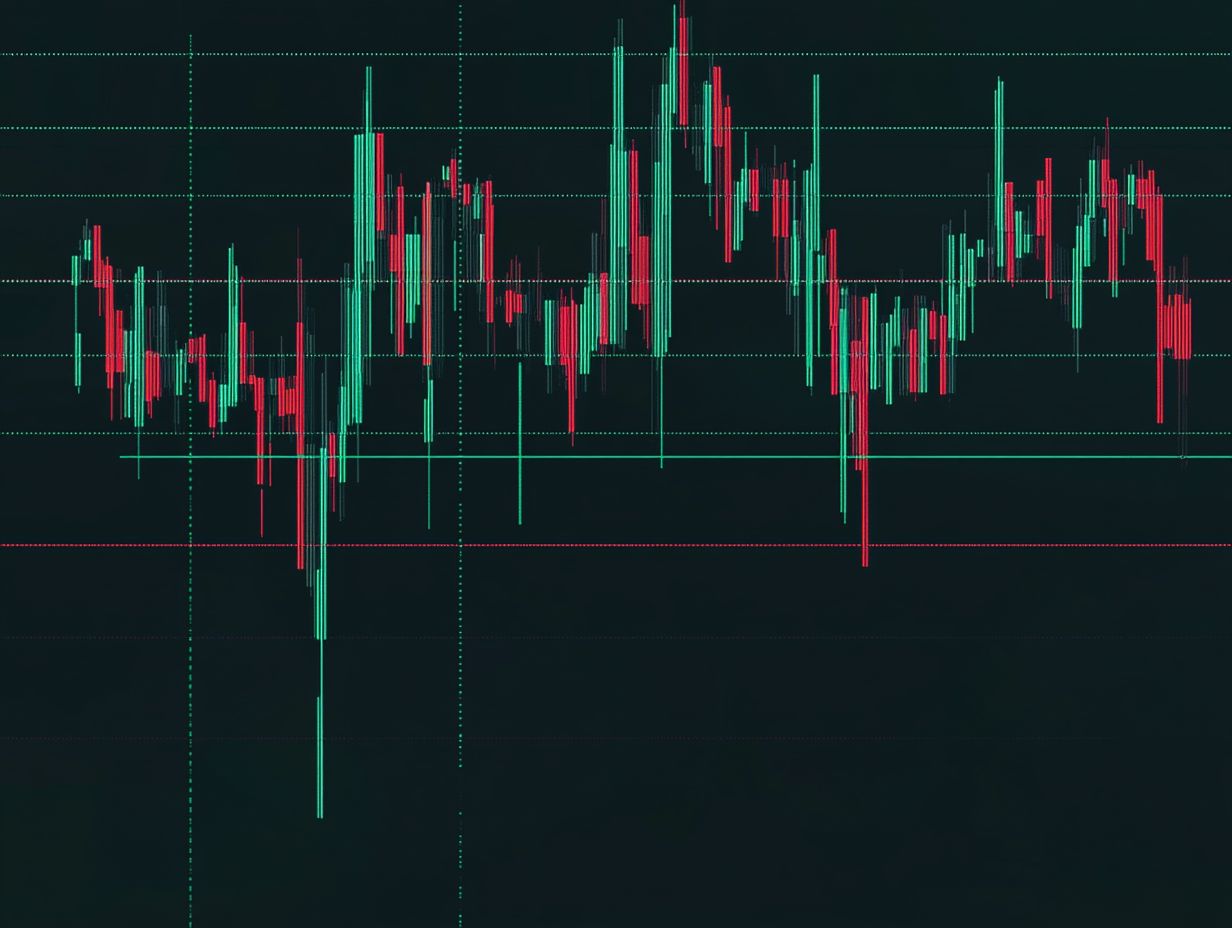
Support levels highlight where buying interest is robust enough to halt a price decline. Resistance levels indicate where selling pressure is strong enough to limit a price increase.
By analyzing these levels, you can make informed decisions regarding your entry and exit points, optimizing your investment strategies and navigating the complexities of the market with confidence.
Importance of Support and Resistance Levels
Support and resistance levels are crucial in shaping your trading strategies, offering valuable insights for technical traders like you who seek to capitalize on price movements in the stock market.
These levels serve not just as guides for your entry and exit points but also help you identify potential price fluctuations. This, in turn, influences market expectations and informs your decisions within the broader financial landscape.
Impact on Trading Strategies
The influence of support and resistance levels on your trading strategies is paramount. These levels act as critical indicators that guide your decisions on whether to pursue short trades or long trades, based on the prevailing market sentiment and price action.
As a trader, you ll often find yourself ready to buy when the price nears a well-established support level, anticipating a rebound as buyers flock in. On the flip side, when prices hit a resistance level, you might decide to sell or even short-sell, expecting the upward momentum to fade.
For example, if you re watching a stock that consistently bounces back from $50, which you identify as a strong support line, your strategy could involve placing buy orders just above this level. Conversely, if this same stock struggles to push past a resistance level at $70, you may opt for short positions, wagering that a downward correction is on the horizon.
These practical applications reveal how you can harness the psychology of other market participants to make astute, informed decisions.
Identifying Support and Resistance Levels

Identifying support and resistance levels is a key element of technical analysis that gives you the power to interpret price charts with finesse.
By leveraging various tools like trendlines and volume levels, you can gain deeper insights into market dynamics. These tools help you discern price patterns and anticipate potential movements, enabling you to act with confidence in the fast-paced world of financial markets.
Technical Analysis Tools and Techniques
Want to make better investment decisions? Let s explore essential tools like trendlines and Fibonacci retracements. These tools are crucial for effectively identifying support and resistance levels within price charts.
They help you grasp price action and make informed investment decisions. By using these tools, you can visually interpret market behavior and pinpoint critical price points where reversals may happen.
For example, trendlines connect significant highs or lows, providing a clearer perspective on the prevailing market direction. Fibonacci retracements use numbers from a sequence where each number is the sum of the two before it. They help predict areas where prices may reverse.
When you combine these tools, you give yourself the power to develop robust strategies. Support levels can indicate where buyers might enter the market, while resistance levels highlight where selling pressure may increase.
This understanding enables you to execute more precise entry and exit tactics in your trading journey.
Using Support and Resistance Levels to Make Trading Decisions
Utilizing support and resistance levels for your trading decisions is a time-tested strategy that gives you the power to refine your entry and exit points. This approach aligns your trades with current price movements and market expectations.
By grasping these essential price levels, you can effectively manage risk and elevate your investment strategies to new heights.
Strategies for Entry and Exit Points
Effective strategies for identifying entry and exit points rely heavily on your ability to analyze market dynamics and price action, particularly at established support and resistance levels. These levels serve as critical junctures for your decision-making.
To truly maximize your trading potential, you might find it beneficial to employ specific techniques, such as seeking out bullish or bearish reversals at these pivotal levels.
For example, when the price approaches a support level and exhibits signs of a bounce, it could signal a strong entry point for you. On the flip side, if resistance is tested repeatedly and fails, that may indicate an excellent exit strategy.
By incorporating tools like candlestick patterns or trend lines into your analysis, you can enhance your ability to assess the likelihood of price movement. This enables you to make informed choices that align seamlessly with your overall trading strategy.
Common Mistakes to Avoid

When trading, it s essential for you to steer clear of common mistakes, particularly misinterpreting support and resistance levels.
Don t overlook the critical factors shaped by market psychology, including emotional behavior and psychological barriers that can skew your perception and influence your actions in the market.
Being mindful of these elements will enhance your trading strategy and decision-making process.
Act now to refine your strategy and avoid costly mistakes!
Misinterpreting Levels and Overlooking Other Factors
Misinterpreting support and resistance levels can lead you down a treacherous path of significant trading losses. It s easy to overlook the powerful influences of fear and greed critical components of emotional behavior that create psychological barriers to effective trading.
When you become overly fixated on these technical indicators, there’s a risk of ignoring the broader market context or pivotal news events that can drastically sway price movements.
It s essential to recognize that emotional responses can cloud your judgment, causing impulsive decisions that stray from your well-researched strategies.
To navigate these risks successfully, maintaining a disciplined trading plan is imperative. By setting clear entry and exit points, practicing mindfulness to manage your emotional reactions, and regularly reviewing past trades, you can cultivate a more balanced approach that helps you avoid falling into these common psychological traps.
Frequently Asked Questions
What are key support and resistance levels?
Key support and resistance levels are price levels on a chart that have historically acted as barriers to the movement of an asset’s price. These levels can be either support, where the price tends to bounce back up, or resistance, where the price tends to fall back down.
Understanding these levels can significantly enhance your trading strategy. Start analyzing today!
How are key support and resistance levels determined?

Key support and resistance levels come from analyzing past price data. Traders look for prices where the market has previously stalled or turned.
Why are key support and resistance levels important?
Key support and resistance levels are game-changers for traders! They help you pinpoint when to jump into a trade or when to back off for better results.
How can I use key support and resistance levels in my trading?
Incorporate key support and resistance levels into your trading strategy. These levels will guide your entry and exit points, plus help manage your risk.
Do key support and resistance levels work in all markets?
Absolutely! You can use these levels in stocks, forex, commodities, and cryptocurrencies. Just remember, they may not always hold up in volatile markets.
Are there any strategies for trading with key support and resistance levels?
Yes, there are many strategies! Explore range trading, breakout trading, and trend following, and find what suits your style and risk tolerance best.


